Bad Timing Hurts!
The stock market has surged upward recently, just as more money is held uninvested in cash than ever before.
The Stress of Missing Out
The perceived safety of cash can be appealing. However, investors seeking to ease their stress might be surprised to find that they are trading one form of anxiety for another. Moving to cash (or bonds) and watching markets surge higher can cause a similar level of anxiety.
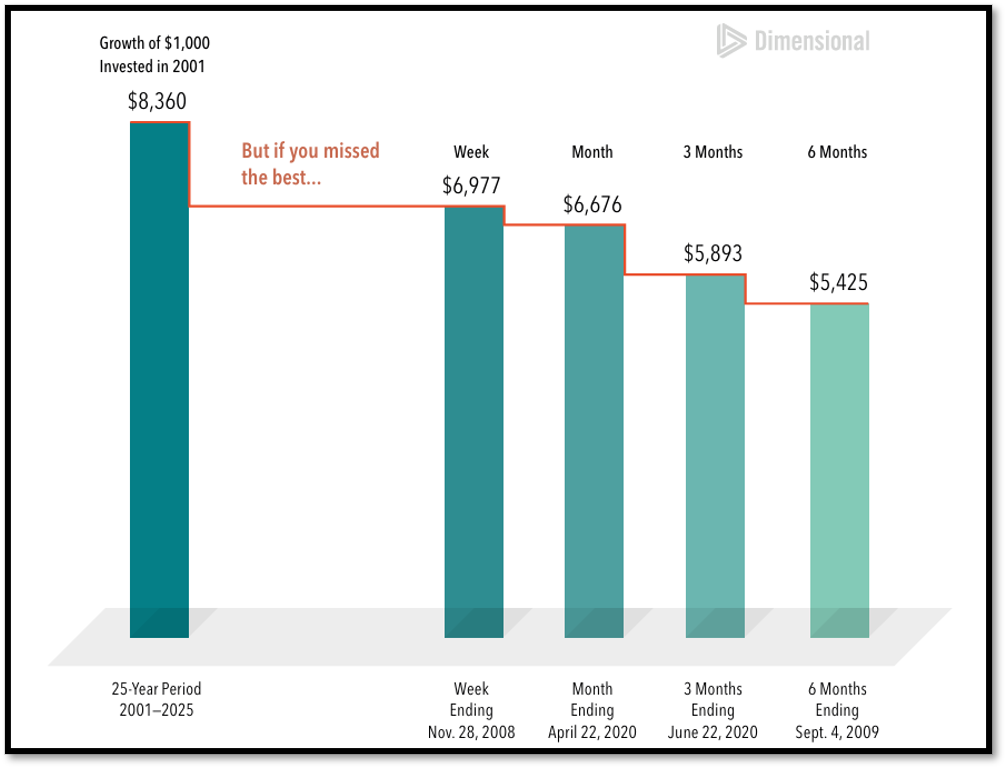
Bad timing can also cause profound damage, as shown by this hypothetical investment in a broad US stock market index1.
A hypothetical $1,000 investment made in 2001 grew to $8,360 over the 25-year period.
- Miss the best week, and the value shrinks to $6,977.
- Miss the best three months, and you've experienced the effects of an average recession, leaving you permanently behind by -29% to $5,893.
- Miss the best six months, and your total return is behind -35% to $5,425
Missing The Best Consecutive Days
U.S. Stock Market, Russell 3000 Index, Total Return
2021-2025
The perceived "safety" of cash can be a siren song, tempting investors upon its rocky shore.
There’s no proven way to time the market— targeting the best days or moving to the sidelines to avoid the worst. Staying invested and focused on the long term helps to ensure that you’re in position to capture what the market has to offer.
Buying at Market Highs
Even buying at market highs has historically worked out for patient investors.
It’s natural to assume that after markets rise, a downturn must be around the corner. That instinct can tempt us to make changes in anticipation of what comes next. Yet the data show that these patterns don't match the historical record.
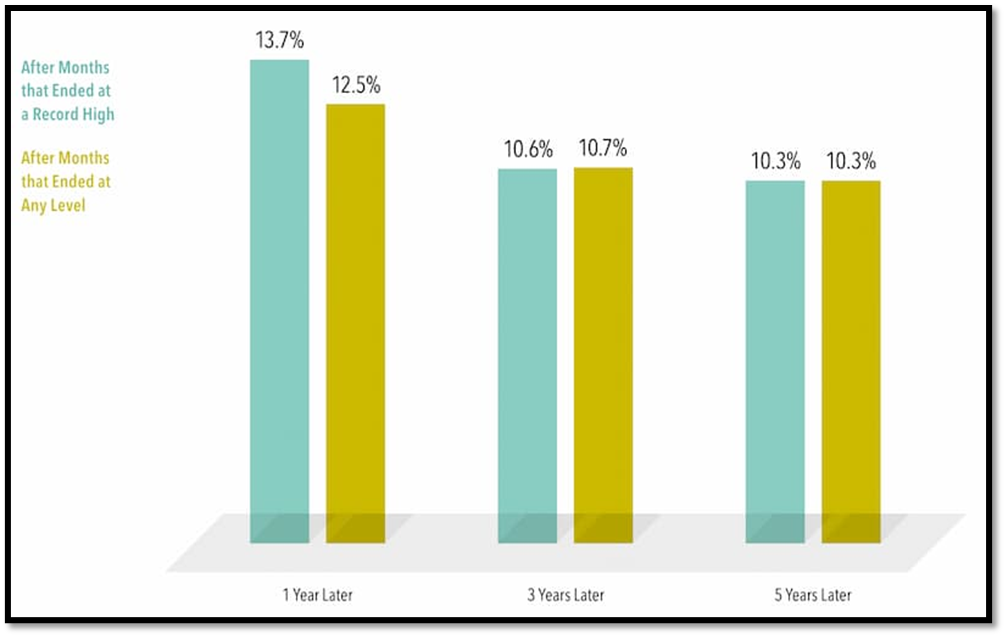
31% of all monthly closes were new highs over the last 98 years, from 1926 to 2024. As the chart below shows, the annualized returns after those highs ranged from almost 14% one year later to more than 10% over the next five years, which were close to average returns over any period of the same length.
Buying in After a Record High
U.S. Stock Market, S&P 500 Index, Average Annualized Compound Returns
1926–2024
While a market correction will come sooner or later, history shows that staying invested throughout tends to be the winning strategy.
If we can help personalize this to you, reach out anytime. Call us at (775) 827-0670 or schedule a 'Quick Connection' time at www.openwindow.com/connection.
Past performance is no guarantee of future results. Indices are not available for direct investment. Their performance does not reflect the expenses associated with the management of an actual portfolio.
Content provided by Dimensional Fund Advisors, LP and adapted by Open Window Financial Solutions, Ltd.
1 - Broad US stock market benchmark represented by the Russell 3000 Index.
In USD. For illustrative purposes. For the purposes of this analysis, we assume the following number of trading days for each period: five trading days in a week, 21 trading days in a month, 63 trading days in three months, and 126 trading days in six months. Best performance dates represent end of period (November 28, 2008, for best week; April 22, 2020, for best month; June 22, 2020, for best three months; and September 4, 2009, for best six months). The missed best consecutive days examples assume that the hypothetical portfolio fully divested its holdings at the end of the day before the missed best consecutive days, held cash for the missed best consecutive days, and reinvested the entire portfolio in the Russell 3000 Index at the end of the missed best consecutive days. Data presented in the Growth of $1,000 exhibit is hypothetical and assumes reinvestment of income and no transaction costs or taxes. The data is for illustrative purposes only and is not indicative of any investment. Frank Russell Company is the source and owner of the trademarks, service marks, and copyrights related to the Russell Indexes.
2 - Broad US stock market benchmark represented by the S&P 500 Index.
Past performance is no guarantee of future results. Indices are not available for direct investment. Their performance does not reflect the expenses associated with the management of an actual portfolio.For illustrative purposes only. Index is not available for direct investment. Performance does not reflect the expenses associated with the management of an actual portfolio. S&P data © 2021 S&P Dow Jones Indices LLC, a division of S&P Global. All rights reserved.