What's My 2026 Tax Bracket?
Each year, the IRS reviews and adjusts specific tax provisions for inflation. Below are the latest updates for the 2026 tax year, including common income, dividend, and capital gain tax brackets.
When discussing tax brackets, which are updated annually, it can be helpful to simplify the start and end points of each tax bracket range. For example, the 24% income tax bracket for married filers ranges from $211,401 to $403,550. Rounding these figures to a simpler range, such as "$200,000 to $400,000," can make initial conversations about tax planning more straightforward and effective.
What tax brackets will your income fall into in 2026?
Rounded Tax Brackets (2026, Federal)
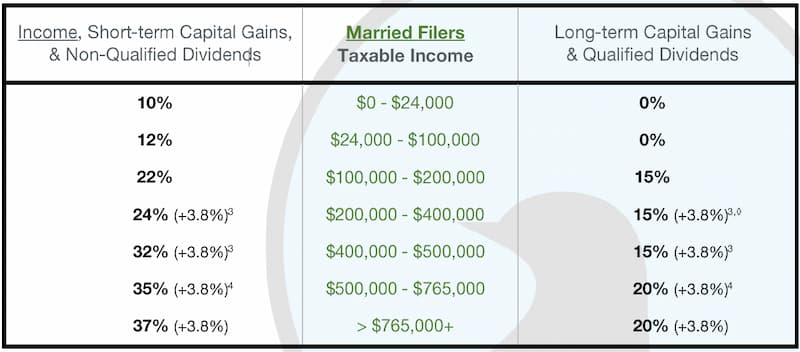
Open Window's Rounded Rates on Taxable Income & Gains
Married (2026)
Single/Unmarried (2026)
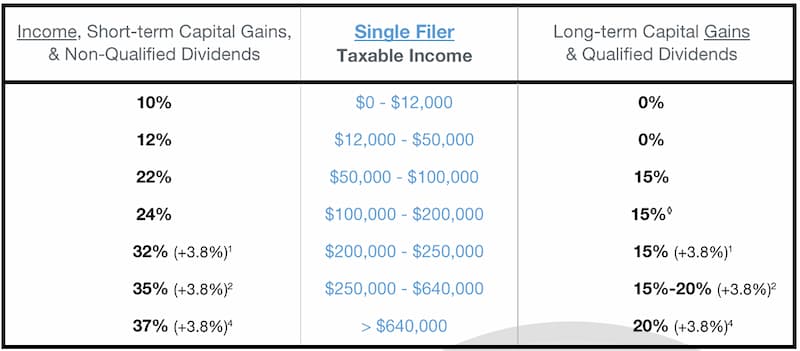
For non-rounded tax brackets, see below and www.irs.gov/newsroom/irs-releases-tax-inflation-adjustments-for-tax-year-2026-including-amendments-from-the-one-big-beautiful-bill
◊ Qualified Business Income Deduction (Sec. 199A) is reduced above income of $201,750 - $276,750 Single, Filers or $403,500 - $553,500 Married Joint Filers.
[1], 3 Net Investment Income Tax (NIIT) or “Medicare” surtax of +3.8% on net investment income (or MAGI – threshold) for incomes >$200,000 Single Filers, >$250,000 Married Joint Filers.
[1], 4 20% rates for incomes ≥$545,500 Single Filers, ≥$613,700 Married Joint Filers.
How Tax Brackets Work (2026, Federal)
To determine your tax liability, the government divides your taxable income into segments, or tax brackets. Each segment is taxed at its corresponding rate. The 2026 federal income tax rates range from 10% to 37%.
In the image below, a married couple earned $575,000, enough to fill the 10%, 12%, 22%, 24%, and 32% tax brackets, leaving the last $30,350 in the 35% income tax bracket.
One key aspect of our tax system is that you don't pay the highest 35% tax rate on all your income. Instead, only the portion of your income that falls within a specific bracket is taxed at that rate. In our example below, $30,350 of income was subject to tax in the 35% bracket. Continuing down the image, $108,900 of income was taxed in the 32% bracket. $192,150 was taxed in the 24% bracket. $110,600 was taxed in the 22% bracket. $76,000 was taxed in the 12% bracket. $24,800 was taxed in the 10% bracket.
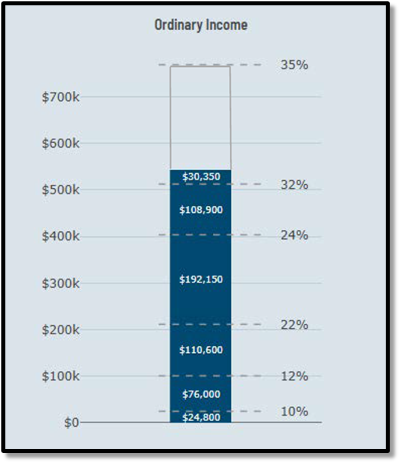
Not pictured is the $32,200 of income subject to a 0% tax rate; income that was ignored due to the 2026 standard deduction of $32,200.
How Gains Stack on Income (2026, Federal)
To determine your total tax liability, gains from the sale of appreciated assets "stack" on top of your ordinary income, called capital gains income. Your ordinary earned income is taxed first, then once all earned income is accounted for, any net capital gains are taxed.
Gains are also applied to a different set of tax rates. The tax rates for capital gains are 0%, 15%, or 20%.
In the image below, the same married couple from above (earning $575,000 in income) sold their home, incurring a capital gain of $400,000. This gain was stacked on top of their $500,000 income to fill the small amount of the remaining 15% capital gains bracket. Most of the gain landed in the 20% capital gains tax bracket.
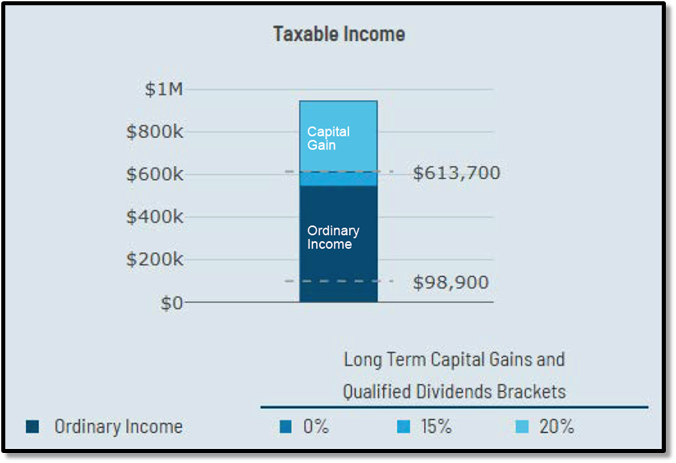
However, like income tax, you don't pay the highest 20% tax rate on all of your capital gains. Instead, only the portion that falls within that bracket is taxed at that rate. Additionally, they were unable to benefit from the 0% capital gains tax bracket because their earned income stacks first. Without their earned income, they would have been eligible for the 0% capital gains bracket.
How Congress Increases Taxes Without Changing Brackets (2026, Federal)
Congress preserved the familiar tax bracket structure under recent federal tax law changes ("OBBBA"), but layered in provisions that can reduce taxes on existing income while causing additional income to be taxed at higher marginal rates than the stated brackets suggest. As these new benefits phase out, including the enhanced senior deduction and SALT relief, many taxpayers experience a higher effective tax rate.
A similar dynamic previously existed with the Net Investment Income Tax, where an additional 3.8% tax applies on top of ordinary income and capital gains taxes once income exceeds certain thresholds.
The 3.8% Net Investment Income Tax (NIIT) applies to the lesser of your net investment income (such as capital gains, dividends, and rental income) or the amount by which your modified adjusted gross income (MAGI) exceeds the applicable threshold: $250,000 for married couples filing jointly, $200,000 for single/unmarried individuals.
Net Investment Income Tax (NIIT) is an additional and separate tax rate that can increase the effective tax rate on existing income and capital gains.
In the image below, the same married couple from above (earning $575,000 of income and with a $400,000 capital gain) sees an increase from a 35.0% marginal income tax rate to a 38.8% income tax rate. Their 20.0% marginal capital gain tax rate increases to 23.8%.

Exact Tax Brackets (2026, Federal)
Exact Rates on Taxable Income & Gains
While the above rates and brackets are at the federal level, different states might have their own brackets and rates.
Ordinary Earned Income Brackets
The tax year 2026 adjustments described below generally apply to taxable income (income earned after deductions) from Ordinary Earned Income, Short-term Capital Gains, and Non-Qualified Dividends:
0% Income Tax Rate (Standard Deduction)
- Single/Unmarried Individuals: First $16,100
- Heads of Households: First $24,150
- Married Individuals Filing Jointly: First $32,200
- Estates and Trust: n/a
10% Income Tax Rate
- Single/Unmarried Individuals: from taxable income of $0 to $12,400
- Heads of Households: from taxable income of $0 to $17,700
- Married Individuals Filing Jointly: from taxable income of $0 to $24,800
- Estates and Trust: from taxable income of $0 to $3,300
12% Income Tax Rate
- Single/Unmarried Individuals: from $12,401 to $50,400
- Heads of Households: from $17,701 to $67,450
- Married Individuals Filing Jointly: from $24,801 to $100,800
- Estates and Trust: n/a
22% Income Tax Rate
- Single/Unmarried Individuals: from $50,401 to $105,700
- Heads of Households: from $67,451 to $105,700
- Married Individuals Filing Jointly: from $100,801 to $211,400
- Estates and Trust: n/a
24% Income Tax Rate
- Single/Unmarried Individuals: from $105,701 to $201,775
- Heads of Households: from $105,701 to $201,750
- Married Individuals Filing Jointly: from $211,401 to $403,550
- Estates and Trust: from $3,300 to $11,700
32% Income Tax Rate
- Single/Unmarried Individuals: from $201,776 to $256,225
- Heads of Households: from $201,751 to $256,200
- Married Individuals Filing Jointly: from $403,551 to $512,450
- Estates and Trust: n/a
35% Income Tax Rate
- Single/Unmarried Individuals: $256,226 to $640,600
- Heads of Households: from $256,201 to $640,600
- Married Individuals Filing Jointly: from $512,451 to $768,700
- Estates and Trust: from $11,700 to $16,000
37% Income Tax Rate
- Single/Unmarried Individuals: over $640,600
- Heads of Households: over $640,600
- Married Individuals Filing Jointly: over $768,700
- Estates and Trust: over $16,000
Gains Brackets
The tax year 2026 adjustments described below generally apply to taxable income from Long-term Capital Gains and Qualified Dividends:
0% Capital Gains Tax Rate
- Single/Unmarried Individuals: $0 to $49,450
- Heads of Households: $0 to $66,200
- Married Individuals Filing Jointly: $0 to $98,900
- Estates and Trust: $0 to $3,300
15% Capital Gains Tax Rate
- Single/Unmarried Individuals: $49,451 to $545,500
- Heads of Households: $66,201 to $579,600
- Married Individuals Filing Jointly: $98,901 to $613,700
- Estates and Trust: $3,301 to $16,250
20% Capital Gains Tax Rate
- Single/Unmarried Individuals: over $545,500
- Heads of Households: over $579,600
- Married Individuals Filing Jointly: over $613,700
- Estates and Trust: over $16,250
We Speak Tax (So You Don't Have To)
Now that your 2026 tax brackets are known, what is your strategy to make the most of these brackets (in 2026 and beyond)?
We can help you seek an optimal approach each year.
At a minimum, if you've never had someone walk through your past tax returns and explain where the amounts came from and how your total tax is calculated, ask us to do so today.
Call us at (775) 827-0670 or schedule a Quick Connection time with us at www.openwindow.com/connection.
This content is developed from sources believed to be providing accurate information. It may not be used for the purpose of avoiding any federal tax penalties. Please consult legal or tax professionals for specific information regarding your individual situation. The opinions expressed and material provided are for general information, and should not be considered tax or legal advice.
For more, see:
Topic no. 409, Capital gains and losses
Topic no. 559, Net investment income tax